
EV Charging Analytics
With its National Fleet Forecasts, E-CUBE provides independent, scenario-based projections of electric vehicle fleets and charging infrastructure in nine European countries up to 2060. They cover passenger cars, light commercial vehicles, buses, trucks, and project the deployment of public and private charge points by power segment.
Our Traffic Assessment tools bring these projections down to the level of a single site. Grounded in observed traffic and charging data, they project local EV charging demand, to assess the business case of a site for light or heavy-duty vehicles.
EV Charging Analytics, E-CUBE’s suite of models to assess charging demand, from country to site
| Light-duty (cars, LCVs) | Heavy-duty (trucks, buses) | |
|---|---|---|
| National Fleet Projections (Country) | Fleets, charge points and market-average utilisation by country, to 2060 (with home / work / public split) | Fleets, charge points and market-average utilisation by country, to 2060 (with depot / public split) |
| Traffic Assessment (Site) | Sessions, kWh sold and utilisation of each charger, calibrated on real charging data | Truck stops, sessions, kWh sold, utilisation of each charger and best station configuration over time, up to megawatt charging |
Our value proposition
Road transport is electrifying across Europe, from passenger cars to long-haul freight. Charging infrastructure has to keep pace, in the right places and at the right size. Our tools help investors, operators and developers decide where to build, how to size their stations and when to upgrade them.
Transaction support
- Provide the parties to a transaction (equity or debt) with independent projections to underwrite market potential, utilisation rates and revenue site by site
Network development
- Evaluate opportunities an optimise configurations site by site: total demand, number of charge points, charger power (including megawatt charging for trucks), utilisation, consumption profile
Strategy and business development
- Compare the potential of sites or countries and test a roll-out plan against national market trends and local competition
Asset management
- Identify stations to extend or reconfigure, and anticipate congestion or overcapacity
E-CUBE’s modelling framework
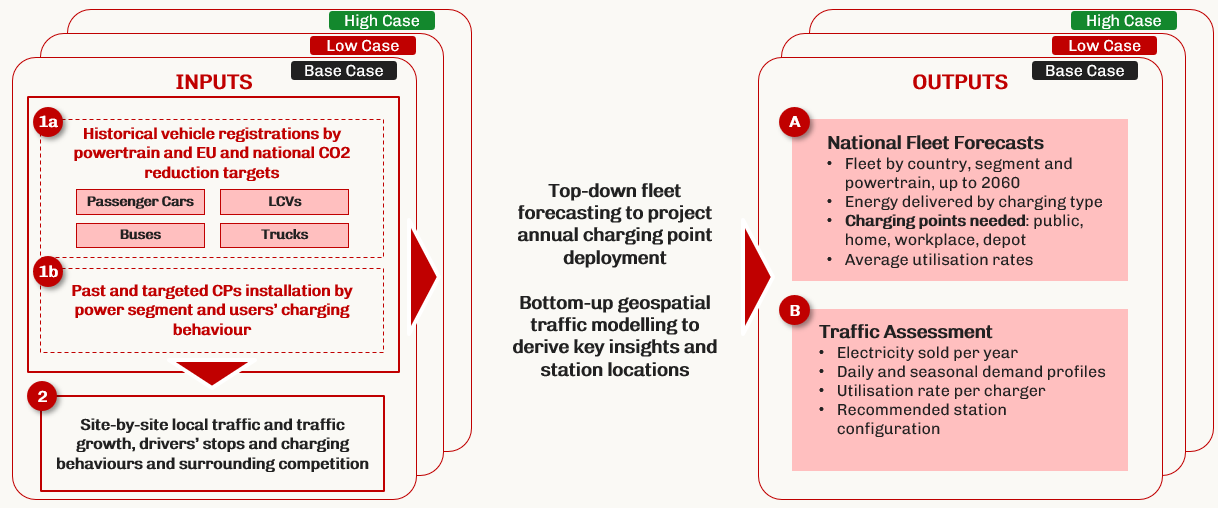
National Fleet Forecasts. Fleet renewal, TCO and regulation drive how fast vehicles electrify. km travelled becomes charging demand, matched against charging infrastructure in each country.
Traffic Assessment. Actual local traffic and charging data are projected forward with fleet electrification and local competition, hour by hour, to size each station.
Clients and use cases
- Charge point operators. We help operators prioritise sites, size each station and time its extensions, so that capacity follows demand.
- Investors and lenders. We provide independent projections of volumes, utilisation rates and revenues to test business plans in acquisitions, refinancing and fundraising.
- Highway concessionaires and service area operators. We quantify car and truck charging demand on each lot and set the station configuration in tenders.
- Utilities and grid operators. We project the energy delivered by charger type and location, to anticipate the grid needs of e-mobility.
What does the service include?
- Highly configurable analysis based on E-CUBE’s models and tailored to your own assumptions (pace of electrification, roll-out plan, site-specific contracts), under 3 scenarios.
- One-on-one workshops with E-CUBE’s e-mobility experts.
- Report with outputs and insights, plus the detailed set of assumptions and results by country, site or lot (PowerPoint and Excel).
National Fleet Forecasts, also available on their own
Long-term curves by country, vehicle segment and charge point type, with the related market-average utilisation rates, delivered as a ready-to-use dataset.
Key advantages
- 3 scenarios built on European and national targets and on recent market trends.
- A detailed view: 9 countries, 5 vehicle segments, all powertrains and 6 types of charging points (public slow, fast and ultra-fast, home, workplace and depot), up to 2060, including:
- Electric vehicle sales and fleet renewal projections, by vehicle category, owner type, and geography.
- Charging behavior projections across home, workplace, and public charging, tailored to local characteristics and the evolution of the EV fleet and charging infrastructure.
- Works both ways: from a charger roll-out plan to utilisation rates, or from a target utilisation rate to the roll-out it requires.
- Actual local charging data, complemented by machine learning for sites not yet built.
- Several electrification scenarios.
- Simulation of charger saturation throughout the day.
- Projection of competing stations around the site, under several scenarios.
- Tailor-made station configuration and sensitivity analyses.
- Demand segmented by charging use case: en-route, destination, on-street and urban fast-charging hubs.
- Actual traffic data around the site.
- Several electrification scenarios.
- Simulation of charger saturation throughout the day.
- Projection of competing stations around the site, under several scenarios.
- Tailor-made station configuration and sensitivity analyses.
- Adjustable assumptions on driver behaviour, such as break durations.
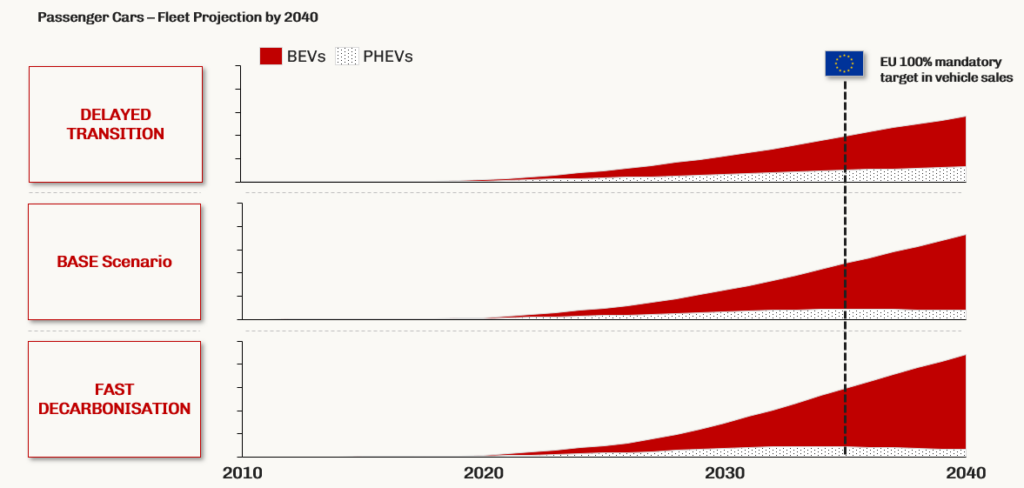
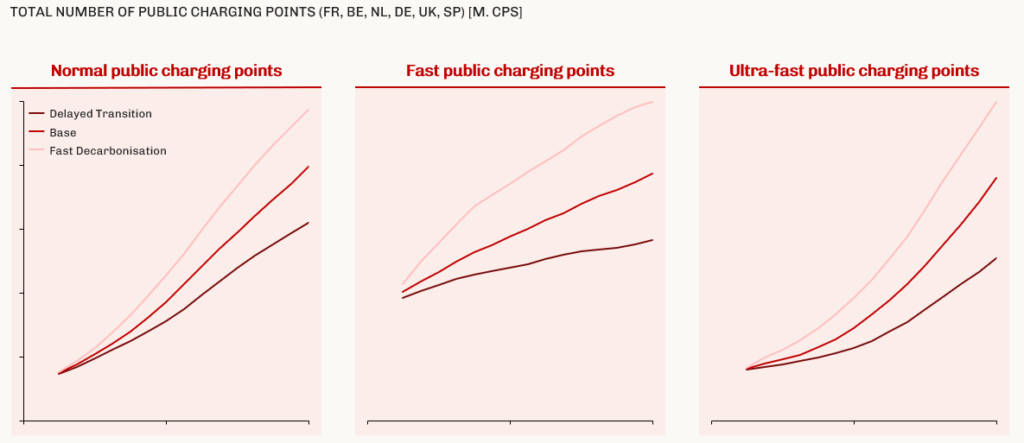
Illustrations of results
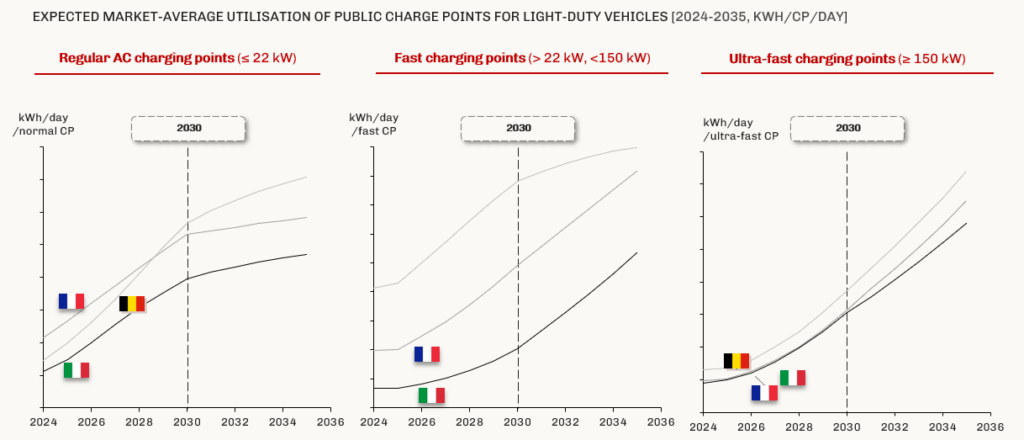
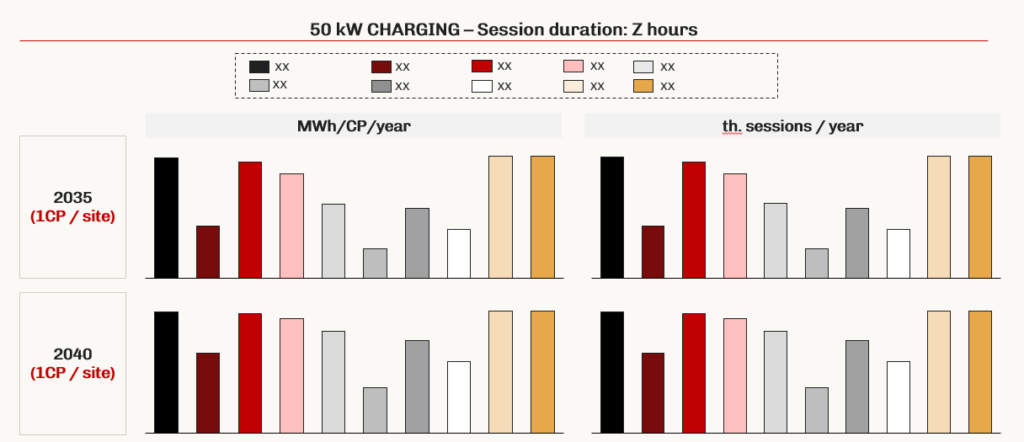
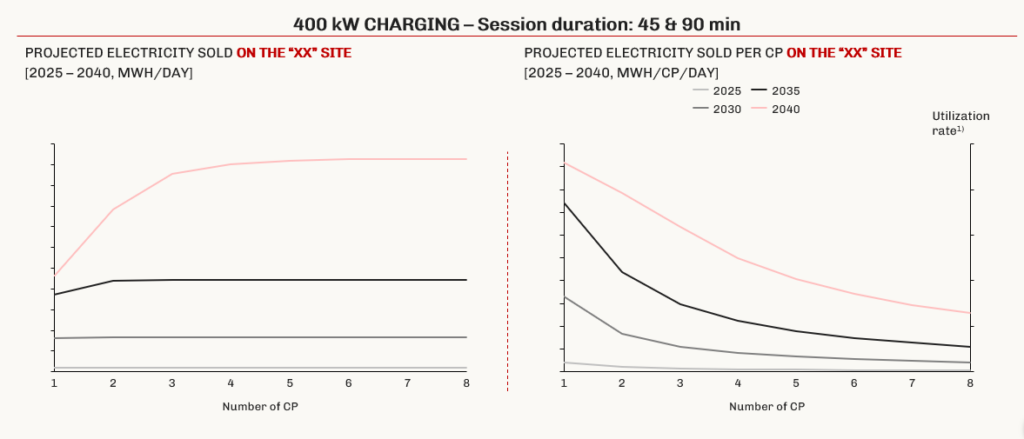
Geographical coverage
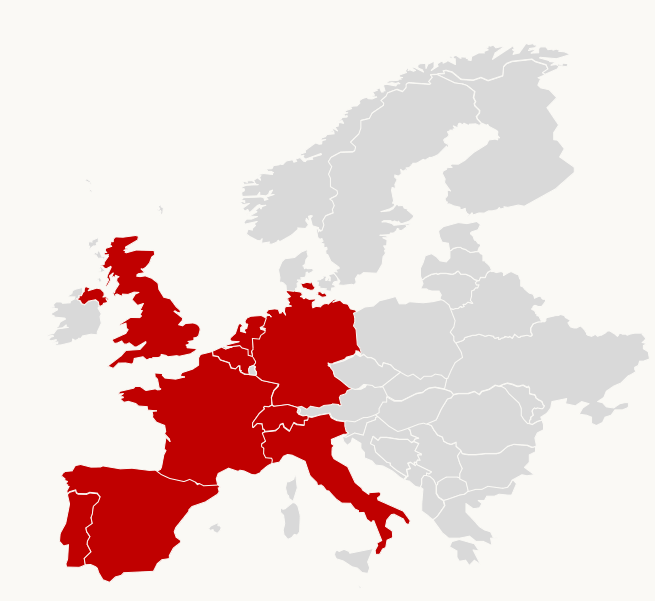
- Belgium
- France
- Germany
- Italy
- Netherlands
- Portugal
- Spain
- Switzerland
Other country upon request
Our mobility experts

Philippe Abiven
Partner – Paris Office
Alexandre Hoffer
Partner – Paris Office
Etienne Jan
Partner – Paris Office
Alexandre Metz
Senior Project Manager