Linaria : Electricity Network Analytics
E-CUBE has developed a multi-scenario model for long-term strategic projections of the impact of the energy transition on electricity networks. This model aims to provide DSOs with a 2025-2050 outlook on their key strategic metrics (financial, resources) so that they can plan and anticipate the necessary requirements for grid reinforcement, while taking into account the specific local characteristics of their service area (e.g. grid topology, consumer types, distributed PV generation, sources of flexibility, etc.).
Linaria, a model designed for DSOs
Swiss distribution system operators (DSOs) are facing a massive increase in photovoltaic (PV) production and the electrification of the consumption (e.g. heating, mobility): Our model enables them to estimate the impact for long-term planning in strategic metrics (internal financial and human resources).
This model uses machine learning to quickly integrate the local specificities of DSOs based on their geodata (e.g. network topology) and/or public geolocated sources at the building level (e.g. RegBL, BFE potential, public charging stations).
Value proposition
- Strategic network planning: Anticipation of the impact on internal resources, particularly financial resources (CAPEX), labour resources (FTE), and the number of construction sites.
- Identification of reinforcement drivers: Analysis of the factors causing network constraints (PV, Heat Pumps, Current, Voltage, etc.) in order to define monitoring indicators and guide the planification strategy (equipment or areas most at risk).
- Estimation of the potential and the value of flexibility for the network: Sensitivity analyses, with or without flexibility modelling (batteries, load shedding, consumption shifts, PV curtailment, adjustable transformers, etc.).
Strengths of the model
- Specific characteristics and dynamics of the DSO’s service area taken into account: Detailed analyses at building level, direct integration of DSO’s data (smart meters, Heat Dristrict planning, etc.).
- Delivery of rapid and effective strategic results: Automated and proven methods with more than five Swiss DSOs, based on standardised public data and AI/ML algorithms.
- Flexible modular approach: structured methodology enabling targeted support and incorporating existing studies.
Learn more about our model
We built and tested a 100% AI/ML model to quickly project the need for electric vehicle charging infrastructure at neighbourhood level (up to 100m2) reflecting local characteristics:
- Learning based on a database of usage rates for over 15,000 charging points in Switzerland, which we have compiled;
- Characterisation of areas near charging stations with over 300 georeferenced features (buildings, roads, traffic, points of interest, etc.), 40-50 of which are fundamental;
- Projection of results at a fine mesh across Switzerland with limited artefacts;
- Continuous improvement of the model with the development of electric vehicles and historical measurement data.
Illustration of locations of interest points for the deployment of public EV charging infrastructure using a machine learning tool

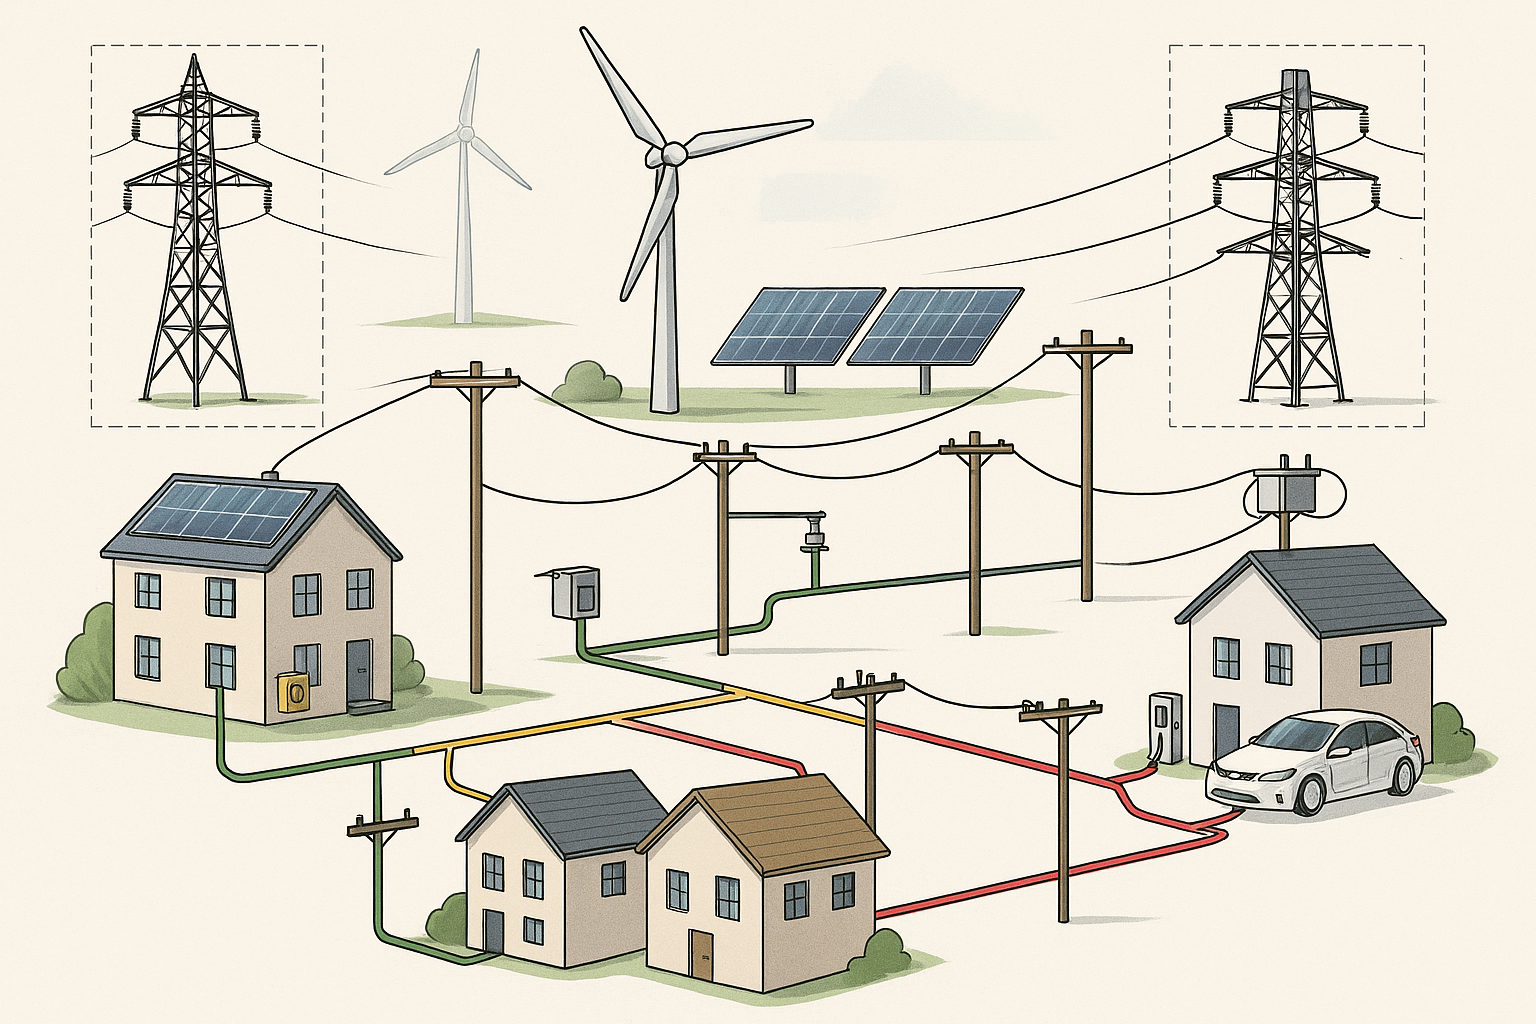
We are building a digital twin of the distribution network (logical paths) to model constraints in terms of current, power and voltage drops:
- Network topology;
- Link to connection points and buildings;
- Technical characteristics of network components: lengths and impedances of LV cable sections and MV segments;
- Sizing criteria: allowed power ratings, currents and voltage drops, safety margins;
- Flexibility solutions (grid batteries, regulating transformers).
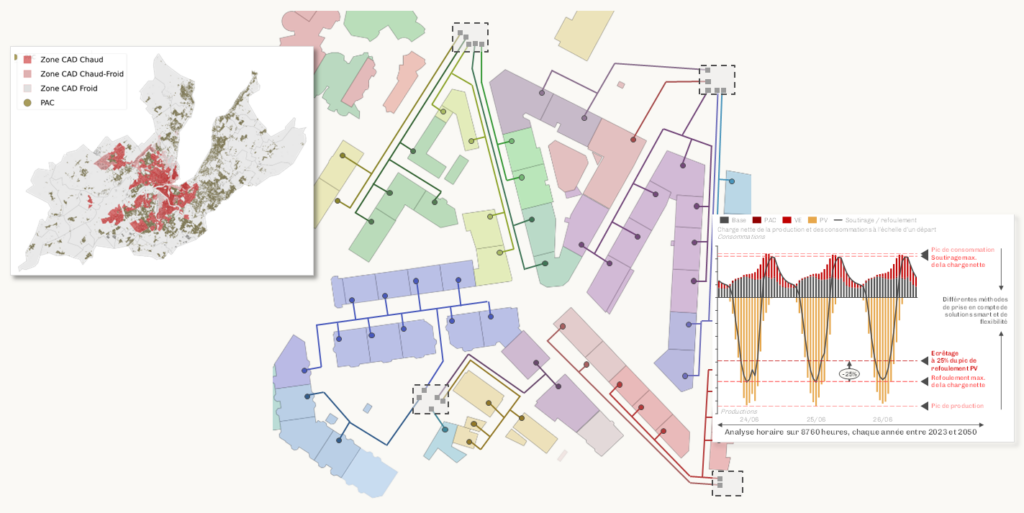
We calculate a net hourly load for each connection (and distributed loads at each network level), taking usage into account. Depending on the situation, we include:
- Smart meter data;
- Network node load measurements;
- Standard time profiles by equipment (heat pumps, private EV charging stations, EV charging stations) and customer segment (villas, buildings, businesses);
- Optimised profiles (e.g. tariff incentives to consume during solar hours);
- Multiplication factors at different network levels (LV output, MV/LV transformer, MV segment, HV/MV transformer);
- Use of batteries (self-consumption);
- PV curtailment.
Net hourly charge with or without PV injection control (guaranteed use for the DSO at 3% of annual production)

The impacts are highly dependent on the type of network and local development conditions. The approach we propose relies as much as possible on local data and assumptions specific to the service area:
- Historical consumption (Smart Meter data);
- Historical consumption (Smart Meter data);
- Type of buildings (villas, apartment buildings, businesses);
- Areas for the development of thermal networks;
- Correspondence with the solar cadastre of roof potential (BFE);
- AI identification of locations of interest for public charging stations;
- etc.
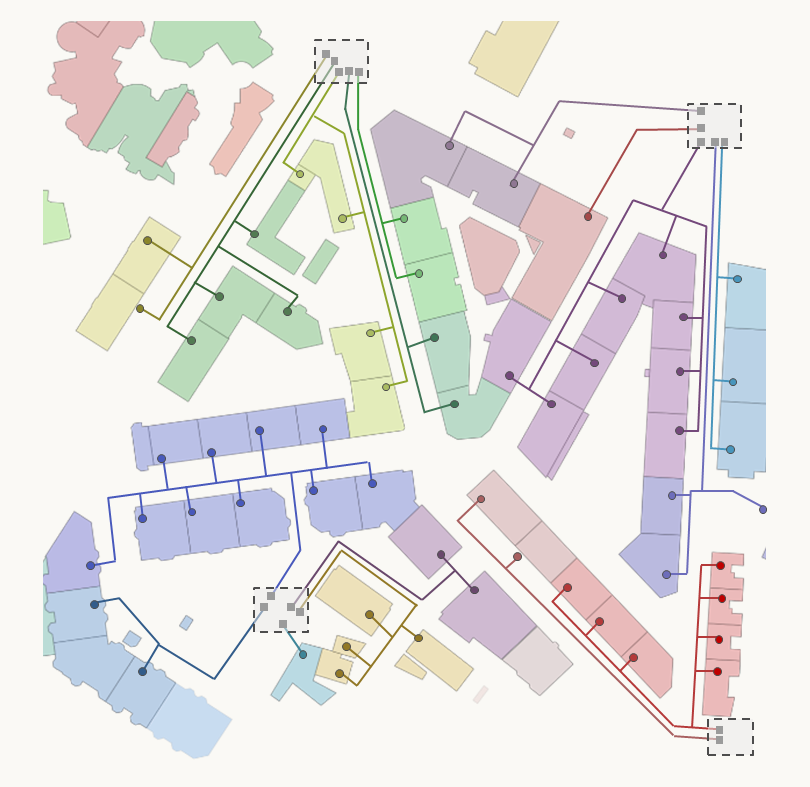
Distribution of PV installations at the level of each LV connection box according to an AI algorithm for prioritising potential and estimating installation sizes, taking into account general framework conditions

Selection of illustrations


Our Network experts

Bruno Meuriot
Project Manager, Co-Head Deutschschweiz
Robin Gobert
Senior Consultant