
PRISM: Battery & Flexibility Analytics
E-CUBE has built PRISM, a Python suite that simulates the value of a flexible-asset portfolio under multiple market scenarios. PRISM gives investors, developers, utilities and grid operators a clear view of BESS project and portfolio economics (revenue stacks, key value drivers and route-to-market strategies) across European markets, while accounting for local market design and the specifics of each asset (duration, network access, cycling limits, bidding strategy, etc.).

PRISM: a transparent, collaborative approach to battery valuation.
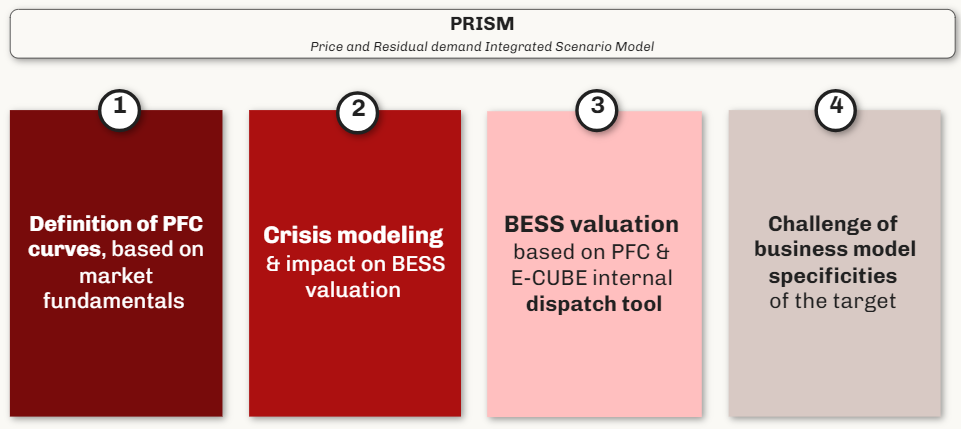
Battery economics are driven by three factors that no forecaster can predict with certainty: the evolution of power supply and demand, the long-run marginal cost of new storage, and crises (the volatility generated by external shocks). The impact of crises are often overlooked, even if they are a major contributor to battery revenues and key to assess the relevance of different route to market contracts.
PRISM completes a PFC-based valuation with transparent, ad-hoc modelling of crises and market fundamentals, and a proprietary dispatch model that reproduces real-world operating constraints. Clients can work on E-CUBE proprietary price curves or on their own / third-party curves.
Value proposition
- PFC definition from market fundamentals: price forward curves built from demand evolution, renewables capacity growth, interconnectors and commodity prices.
- Crisis modelling: episodes of heightened volatility scenarised from historical data, and their impact on BESS value pockets and overall battery value.
- BESS valuation: valuation on E-CUBE or third-party PFCs, using E-CUBE’s proprietary dispatch tool.
- Business-model challenge: review of the development platform’s business model, including route-to-market, operational capabilities and pipeline fall-rate.
Strengths of the model
- Transparency & co-construction: full visibility on the drivers behind the modelled price curves, with market scenarios co-built with the client.
- Fidelity of the modelling: integration of over- / under-volatility episodes that fundamental models miss, plus customisable dispatch strategies reflecting aggregators’ operational capabilities and each asset’s contractual constraints.
- Flexibility for the client: market revenues can be modelled on E-CUBE proprietary curves or on third-party price curves.
- Breadth of support: the tool can sit within a broader strategy-consulting engagement that challenges not only revenue streams but also project costs, execution capability and the underlying business model.
Learn more about our model
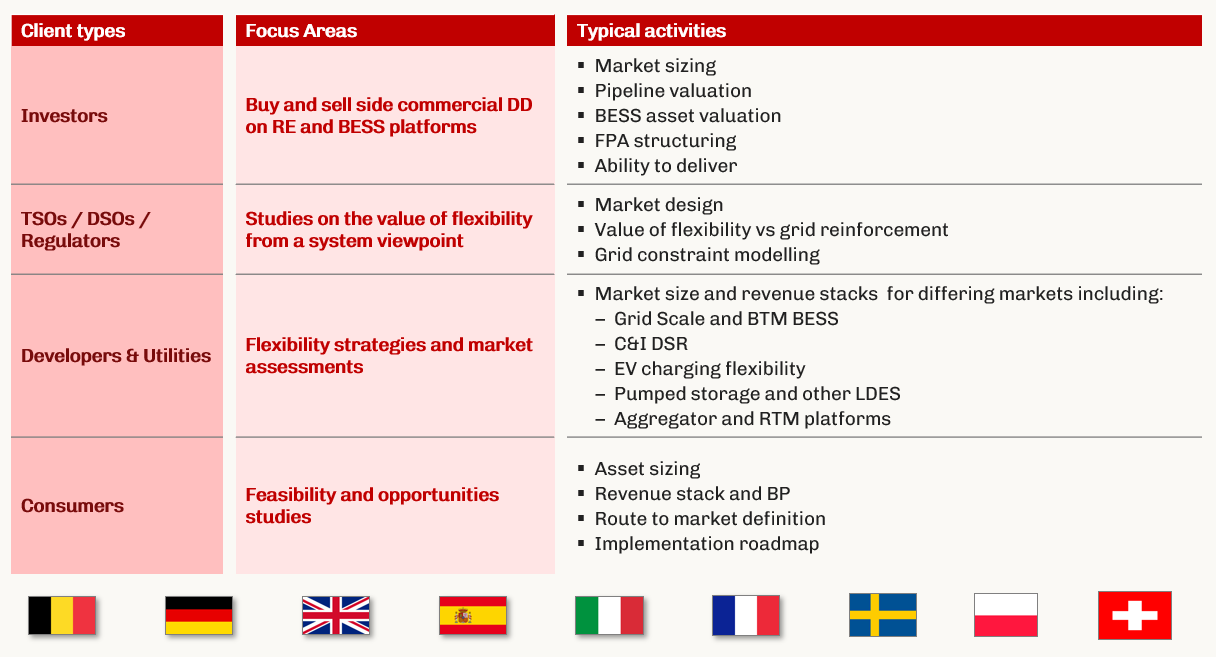
PRISM supports four client types across the flexibility value chain:
- Investors: buy- and sell-side due diligence on BESS platforms
- Developers & utilities: flexibility strategies and market assessments
- TSOs / DSOs: assessing BESS value for the network
- Large consumers
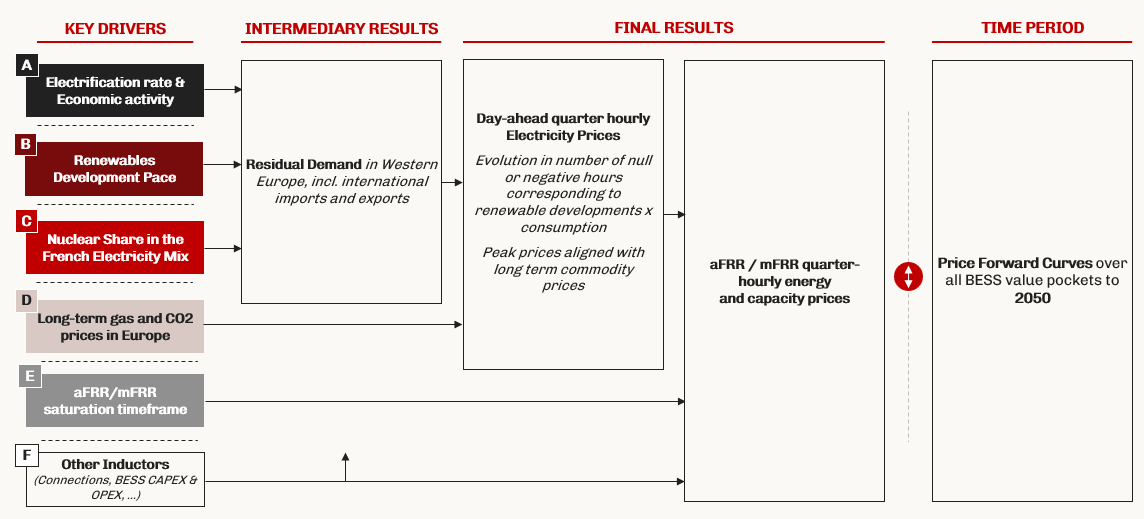
We define a price forward curve (PFC) for each BESS market from a transparent set of fundamentals, rather than a black-box model:
- key inductors: national residual demand, installed RE capacity × load factor, installed thermal capacity × load factor, gas and CO₂ prices, TSO balancing needs and BESS build-out;
- drivers derived from public scenarios (e.g. TYNDP), analysis of past crises on the day-ahead market and the grid-connection pipeline;
- on the day-ahead market: selection of the third-party PFC that best fits expected PV capture rates, then deformation of peak prices based on thermal-activation needs and gas + CO₂ prices;
- on ancillary services and balancing: prices modelled from BESS penetration, value-pocket size and the opportunity cost of bidding on other markets.
Five fundamental drivers feed into residual demand, which in turn shapes the day-ahead and ancillary services forward price curves over 2026-2045.
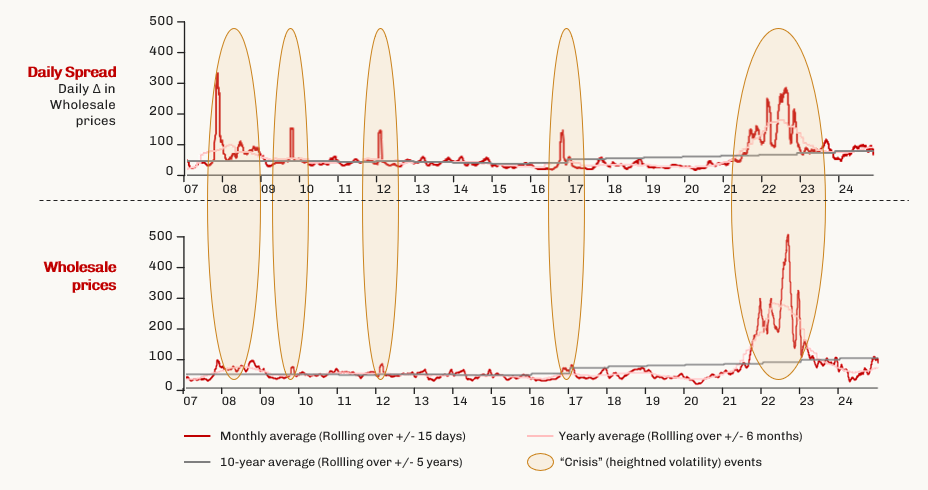
Crises have historically been a major driver of BESS revenues, yet specialised forecasters rarely model them; we scenarise their frequency and depth from historical European price data:
- three crisis archetypes identified from 2007-2024 price dynamics: short-term capacity shortages (spreads only), structural system defaults, and gas-supply shocks (spreads and absolute prices);
- calibration on observed events, e.g. the 2008 coal shortage and the 2021-2022 gas + nuclear crisis in France;
- country-specific likelihoods: France historically crisis-prone through its nuclear dependence; Germany increasingly exposed as renewables penetration rises;
- each crisis is translated into a deformation of the PFCs (e.g. +150% to +300% on day-ahead spreads) and propagated to the BESS value pockets.
As flexible assets are built out, each market saturates and prices converge toward the missing money of the optimal asset; PRISM captures this cannibalisation explicitly:
- FCR is volume-stable and priced by the marginal cost of participating 1h batteries;
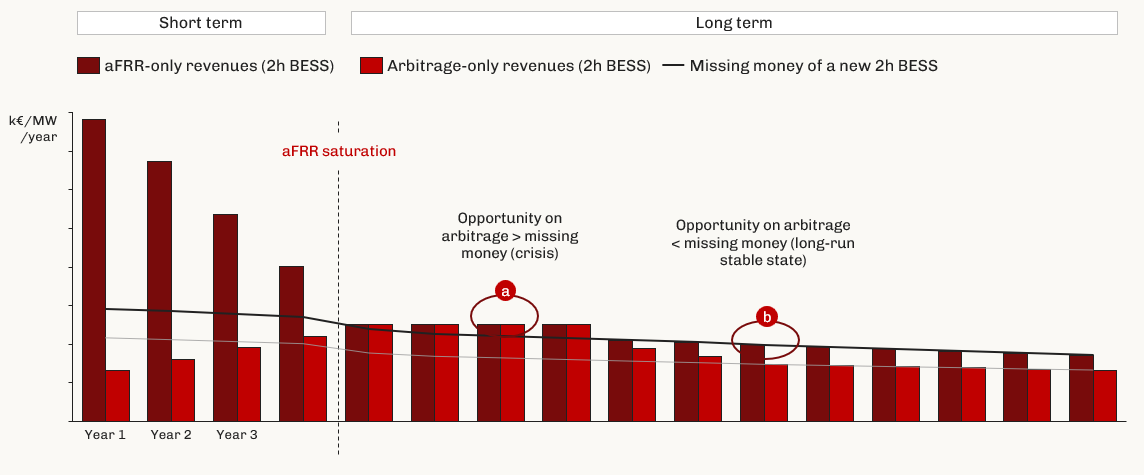
- once saturated by batteries, aFRR is priced by the missing money of a new 2h BESS (LRMC less capacity revenues);
- arbitrage spreads grow with renewables but, once saturated, align with the missing money of a new 4h BESS;
- the three markets are interdependent: ancillary-services prices are lower-bounded by the opportunity cost of not bidding on the others.
Revenue of a 2h (aFRR-optimal) battery revenues as the ancillary-services market saturates and value shifts toward arbitrage (illustrative).
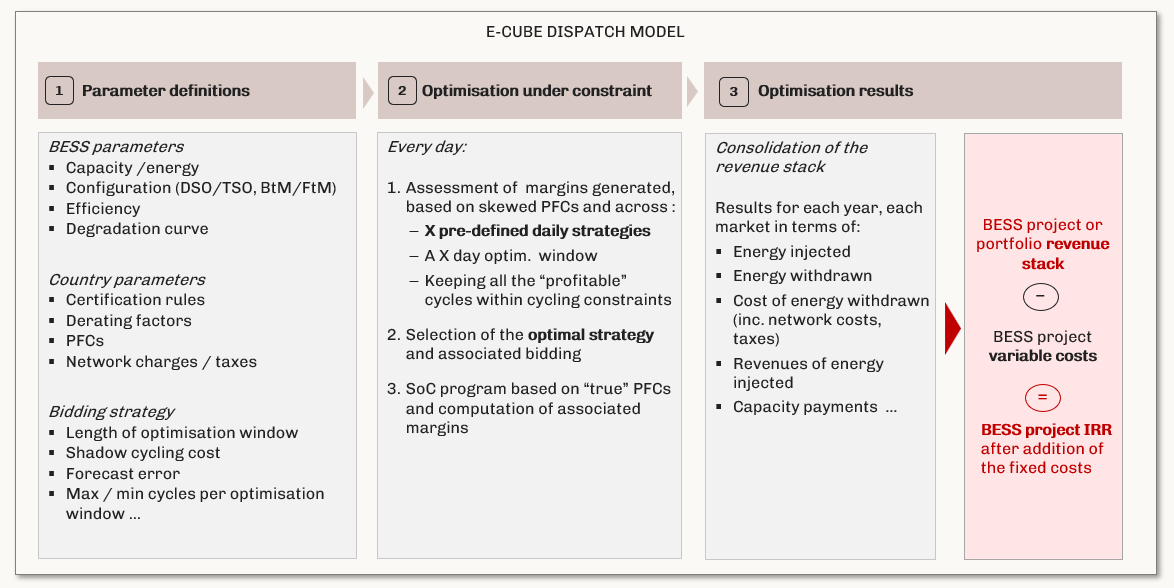
We optimise the battery on the chosen PFCs with a proprietary dispatch model that replicates a real optimiser’s decisions under imperfect foresight:
- sequential decision-making, with bids placed at each market gate closure depending on earlier accepted bids;
- imperfect foresight: decisions made on a skewed version of the PFCs that sharpens approaching real time;
- margin maximisation (not revenue) at 15-minute granularity, under asset constraints (state of charge, degradation) and market constraints (certification rules);
- configurable bidding strategy, optimisation window, cycling limits and forecast error, to reflect each operator’s capabilities.
Structure of the dispatch model
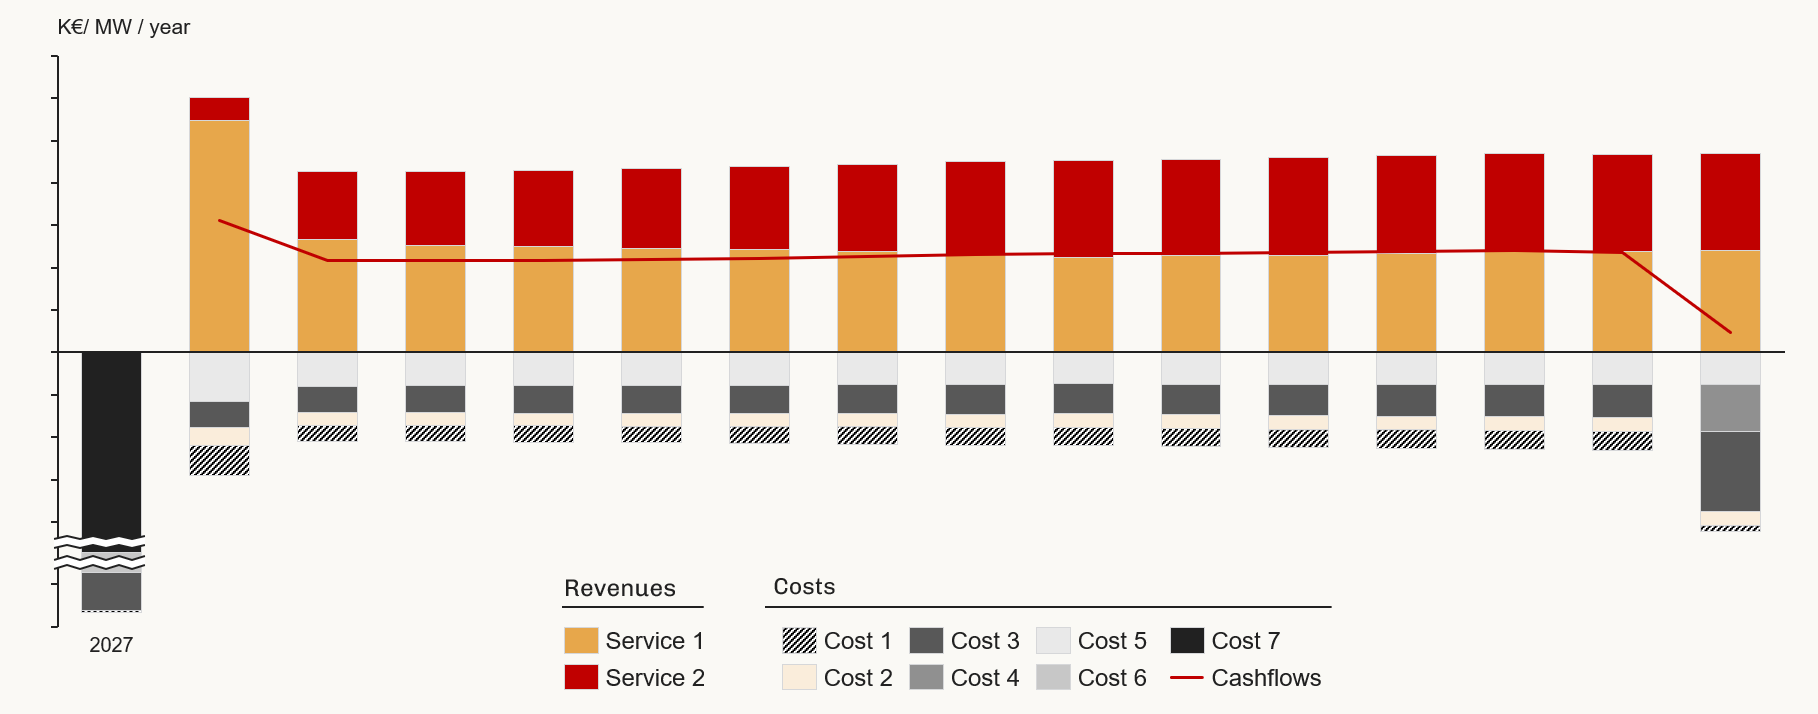
The dispatch results feed a revenue stack and a full business plan, so value is read as a distribution across scenarios rather than a single point estimate:
- Revenue stack by year and by market: energy injected / withdrawn, cost of energy withdrawn (incl. network charges and taxes), revenue of energy injected, capacity payments;
- integration with upfront CAPEX, fixed O&M and development costs to derive project IRR;
- results produced for every market scenario and asset sizing, yielding a dispersion rather than a single figure;
- identification of the key value levers and risk drivers, and a challenge of the route-to-market strategy (merchant vs. floors / tolls).
Business Plan for a typical BESS project
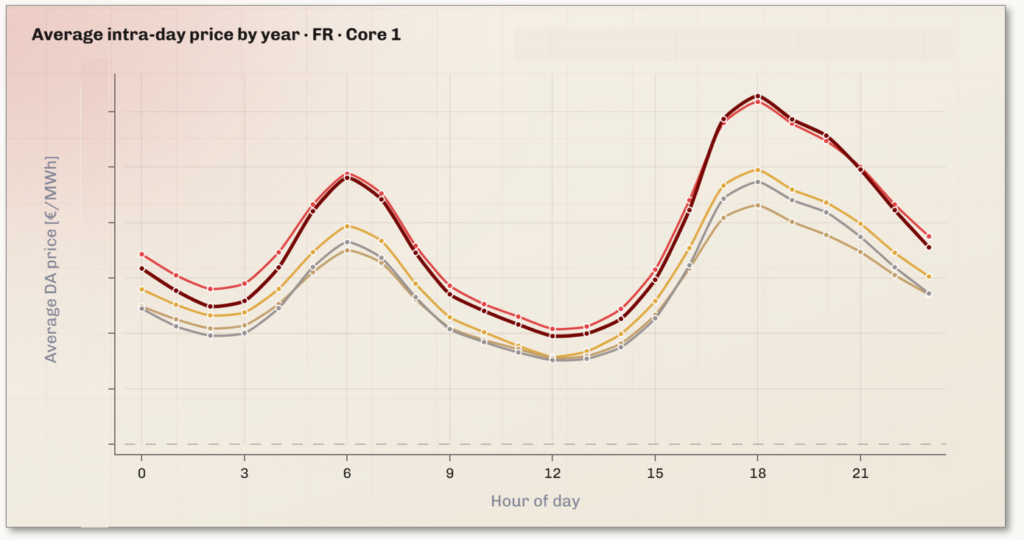
Selection of illustrations


Our Flexibility experts

Pierre Germain
Founding partner – Paris & London Offices
Etienne Jan
Partner – Paris Office
Damien Ferrier
Senior Project Manager